NTSC Waveforms and Spectrum Analyzer Signals
Here are a couple of photos of NTSC video waveforms that are used to check
channel flatness, and the resulting spectrum display from a modulator that has an RF
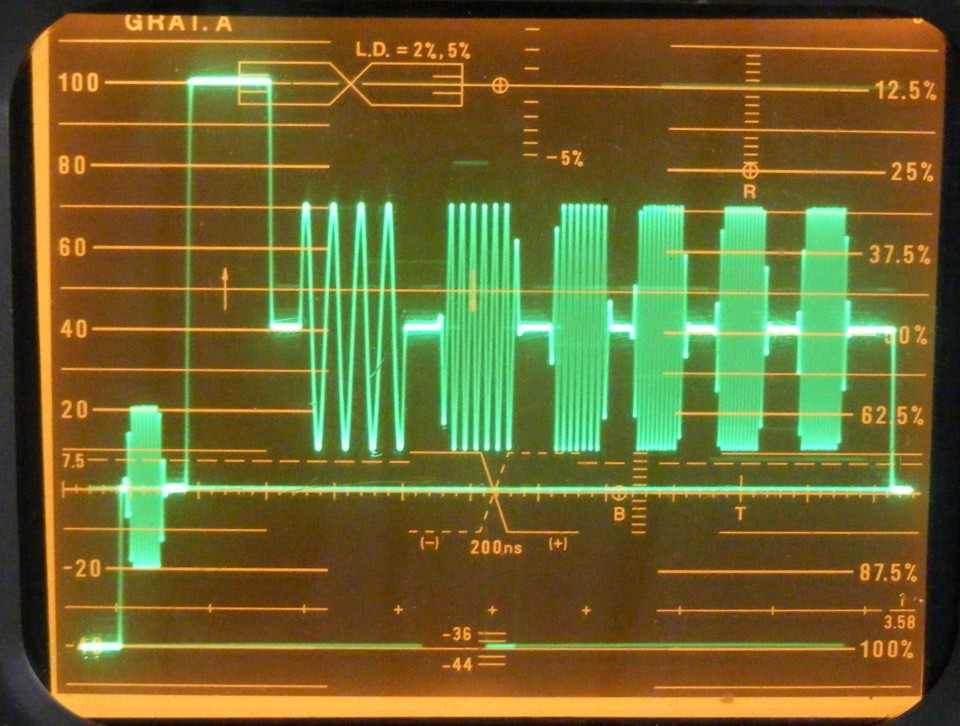
flatness issue at the output. This first waveform is a MULTIBURST shown on a
Tektronix 1480R waveform monitor.
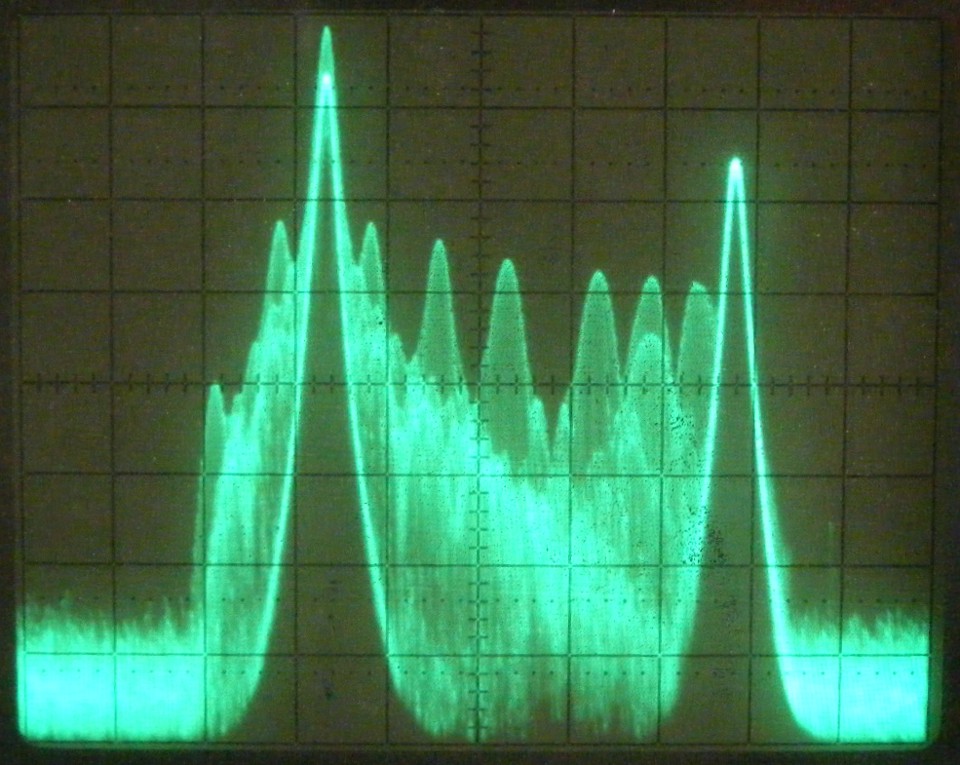
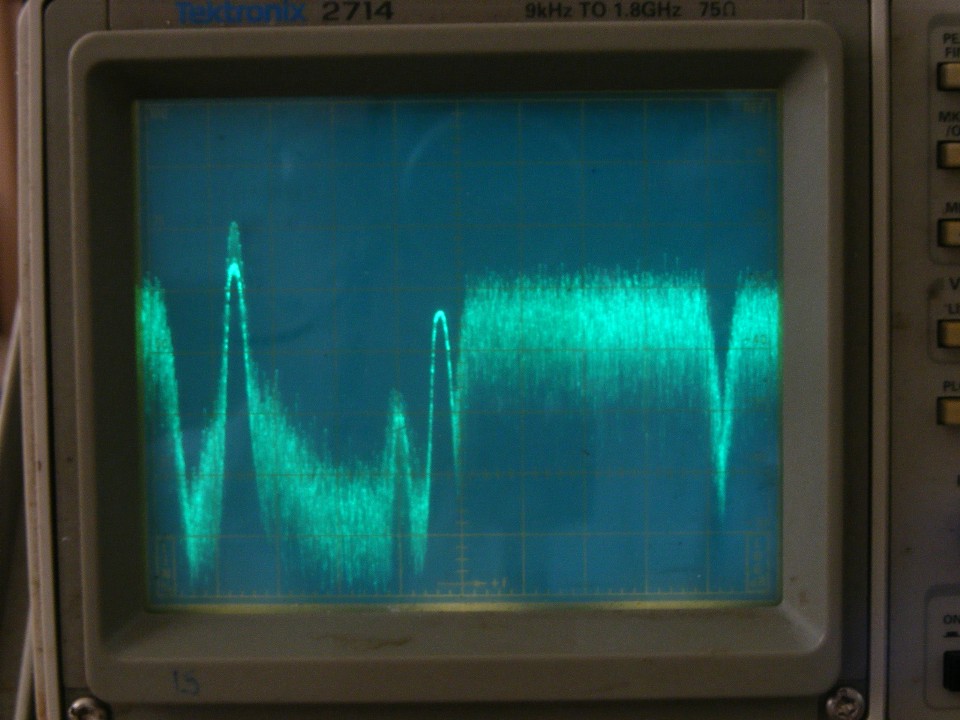
Here is the resulting video channel from a modulator that has the video input
from the photo above. Take note of the downward slope of the RF sidebands from the
multipulse video input. They should all be the same amplitude -- FLAT. The
spectrum analyzer is displaying 10 dB per vertical division and 1 MHz per horizontal
division (1 cm squares).
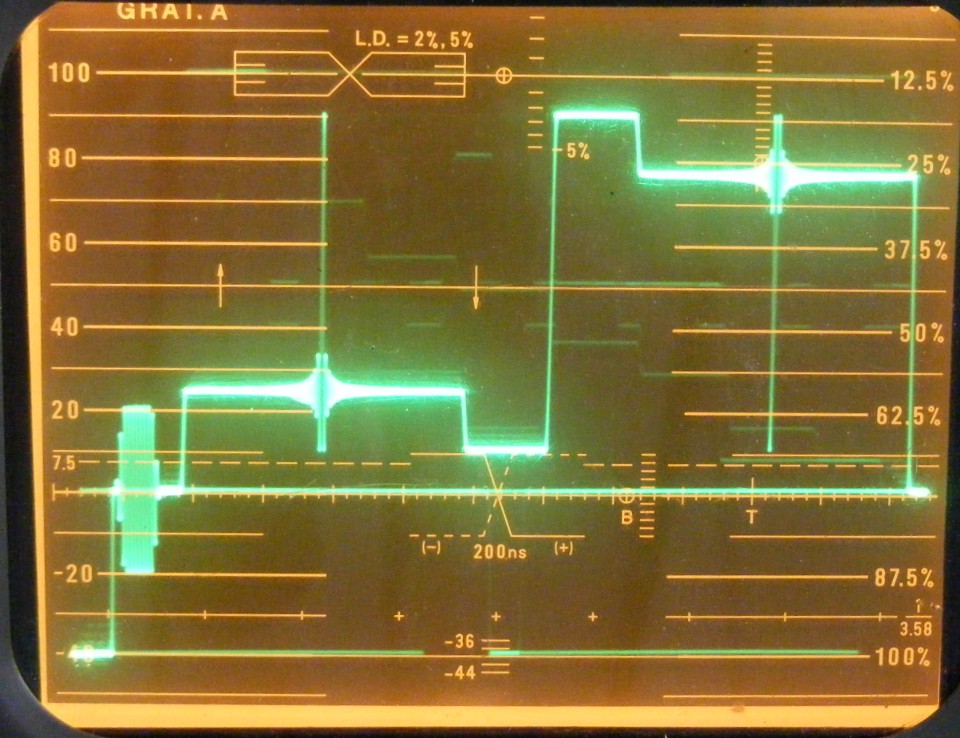
This next waveform is called SINE X over X. It is written as SIN X / X on
video signal generators that can produce it.
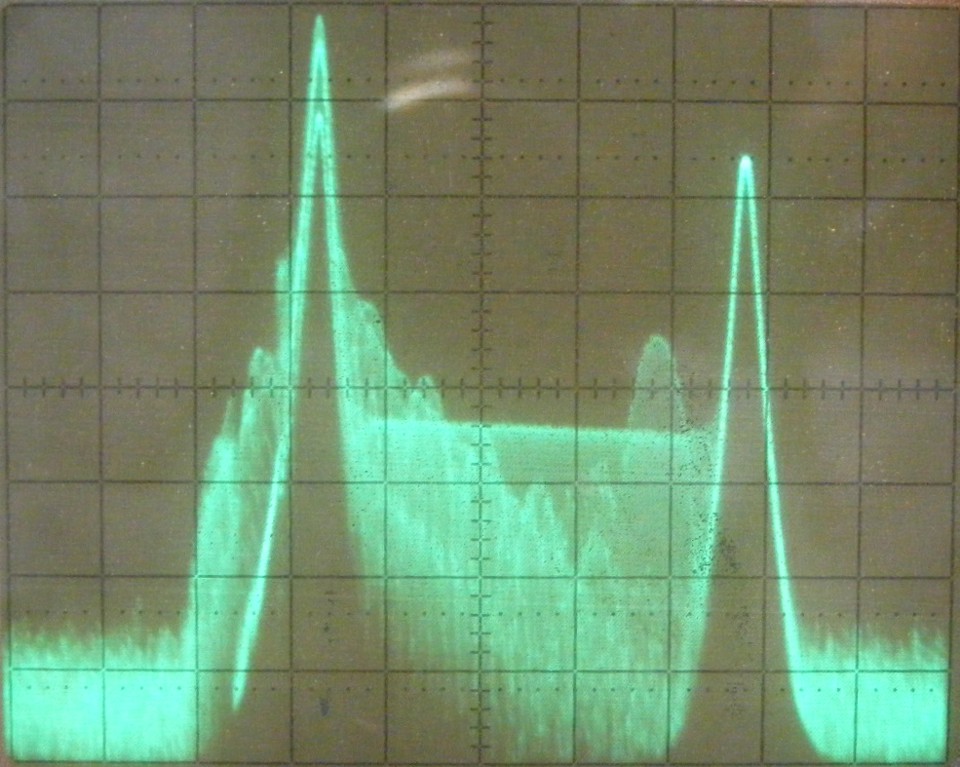
Here is what makes that waveform so magical. The linear set of sidebands
visible in between the video carrier on the left and the sound carrier on the right is the
result of the waveform in the photo above. When that linear set of sidebands are
FLAT, then the modulator is properly aligned. This waveform acts as a video sweep
generator. In this spectrum analyzer image, the SIN X/X waveform is on every video line,
not just one line in the vertical interval of the television signal.
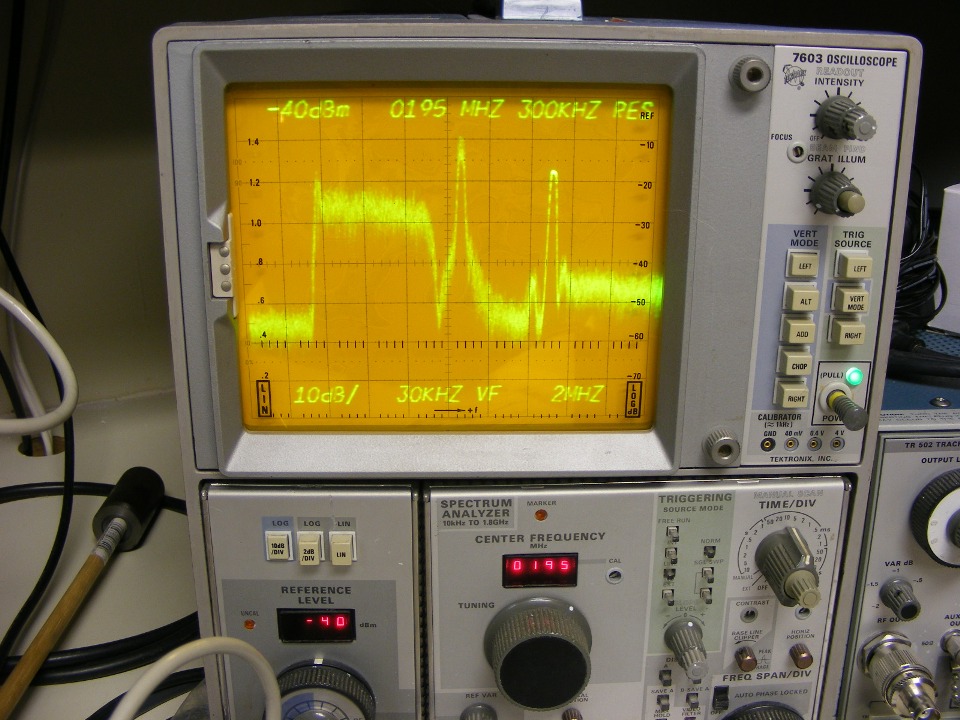
I also wanted to add this spectrum analyzer display photo showing ONE analog
NTSC television channel adjacent to QAM 256 digital television signals. Yes, the big
cable companies talk about getting "Digital Cable" for more channels. You need
to understand what they are talking about. It is the processing of the various MPEG
video digital bit streams at the headend and again inside that "cable box" that
provides all those channels to your television set. The processing of those signals
at the headend results in an RF carrier with up to 256 levels of phase-angle and RF
amplitude modulation on a carrier wave that fits in ONE 6 MHz television channel. It
looks like a haystack on an RF spectrum analyzer. It is an RF analog-modulation
format that represents a serial digital bit stream containing several video signals
viewable after the "cable box" decodes those bit streams for your TV set.
The three signals on the left side of the spectrum analyzer display below make up ONE
analog NTSC color television channel. Inside a cable television system, the sound
carrier is transmitted 15 dB lower in power than the video signal to allow a television
set to work successfully with adjacent television channels. The "fuzzy
haystack" QAM 256 signal is on the right side of the display screen can have TWO
high-definition channels on it, or up to 13 standard definition video channels on a
Comcast Cable system like the one in Chattanooga where I took this photo. QAM
signals can also carry high-speed data signals for internet connections. There is a
"notch" between two adjacent QAM signals at the right side of the display below.
The notch is the guard band that separates on QAM signal from the one in the RF
channel next door. At the far left side of the display is another QAM signal on the
new channel lower than the NTSC analog signal. The width of the notch
display is a function of which spectrum analyzer I.F. bandwidth filter is used
for this snapshot.
Using a digital signal level meter to monitor a QAM 256 channel, the
constellation of ANALOG amplitude and phase-modulated data points can be displayed.
A normal distribution of the signal vectors looks like the graphic image seen
below. If you tried to put a QAM signal on channel 2 from 54 MHz to 60 MHz, the
group delay of two-way diplex filters in the RF amplifiers would distort the patterns of
dots to the point where they may fall outside the boxes below and the channel would
develop "tiling" or a "blocky" image that jerks or fails completely.
Each box below represents a number from Zero to 255 or 00 to FF in hexadecimal
computer code. All those 256 possibilities are the result of converting television
signals to a digital bit stream of numbers representing MPEG encoded and compressed data
that can be restored as high-definition or standard definition TV pictures. Cable
modem internet service can also be transmitted as a QAM-256 RF signal.
In case you missed this photo, here is a comparison of an off-air analog RF
NTSC television channel and an 8VSB over-the-air digital television channel.
This close-up of the Tektronix 7L14 spectrum analyzer shows local analog and
digital television channels in the Atlanta area. That analog channel near the center
of the screen is VHF channel 11, with an 8VSB digital TV transmission just to the left on
channel 10 (192-198 MHz). It is the broad, FLAT looking signal with little peak at
the left. The flat portion of the signal trace from the far left of the screen going
less than two squares toward the signals is the noise floor where no television signal is
present. The center frequency tuning readout is out of calibration. There is a
pot to adjust it, but I did not think to do that before snapping these photos. That
tallest analog RF carrier is at 199.25 MHz. There is a weaker digital television
signal on channel 12 at the right side of the display screen. That channel
is coming from Chattanooga, Tennessee about 100 miles north.
I put the spectrum analyzer screen into analog display mode to give a realistic view of the television signals. This is what I have been doing since 1971, television transmission systems via coaxial cable, satellite uplinks, and ground stations. I currently work with television transmissions via fiber optics networks. For those of you who are not familiar with the NTSC analog television signals we have been watching for the past 50+ years, the tallest signal is the picture carrier containing the horizontal and vertical sync pulses, plus the black and white portion of the TV channel. The second tallest carrier is the frequency-modulated sound carrier at a frequency that is 4.5 MHz higher than the picture carrier. The sound carrier signal is typically transmitted at a power level from 6 to 10 dB lower than the picture carrier by television stations. It is shown here 8 dB lower. The sound carrier is set to 15 dB lower in strength in a cable television system to allow the use of adjacent channels. The small signal between the two tallest RF carriers is the color sub-carrier and it varies in strength with changes in phase and amplitude with the color content variations of the analog television picture.
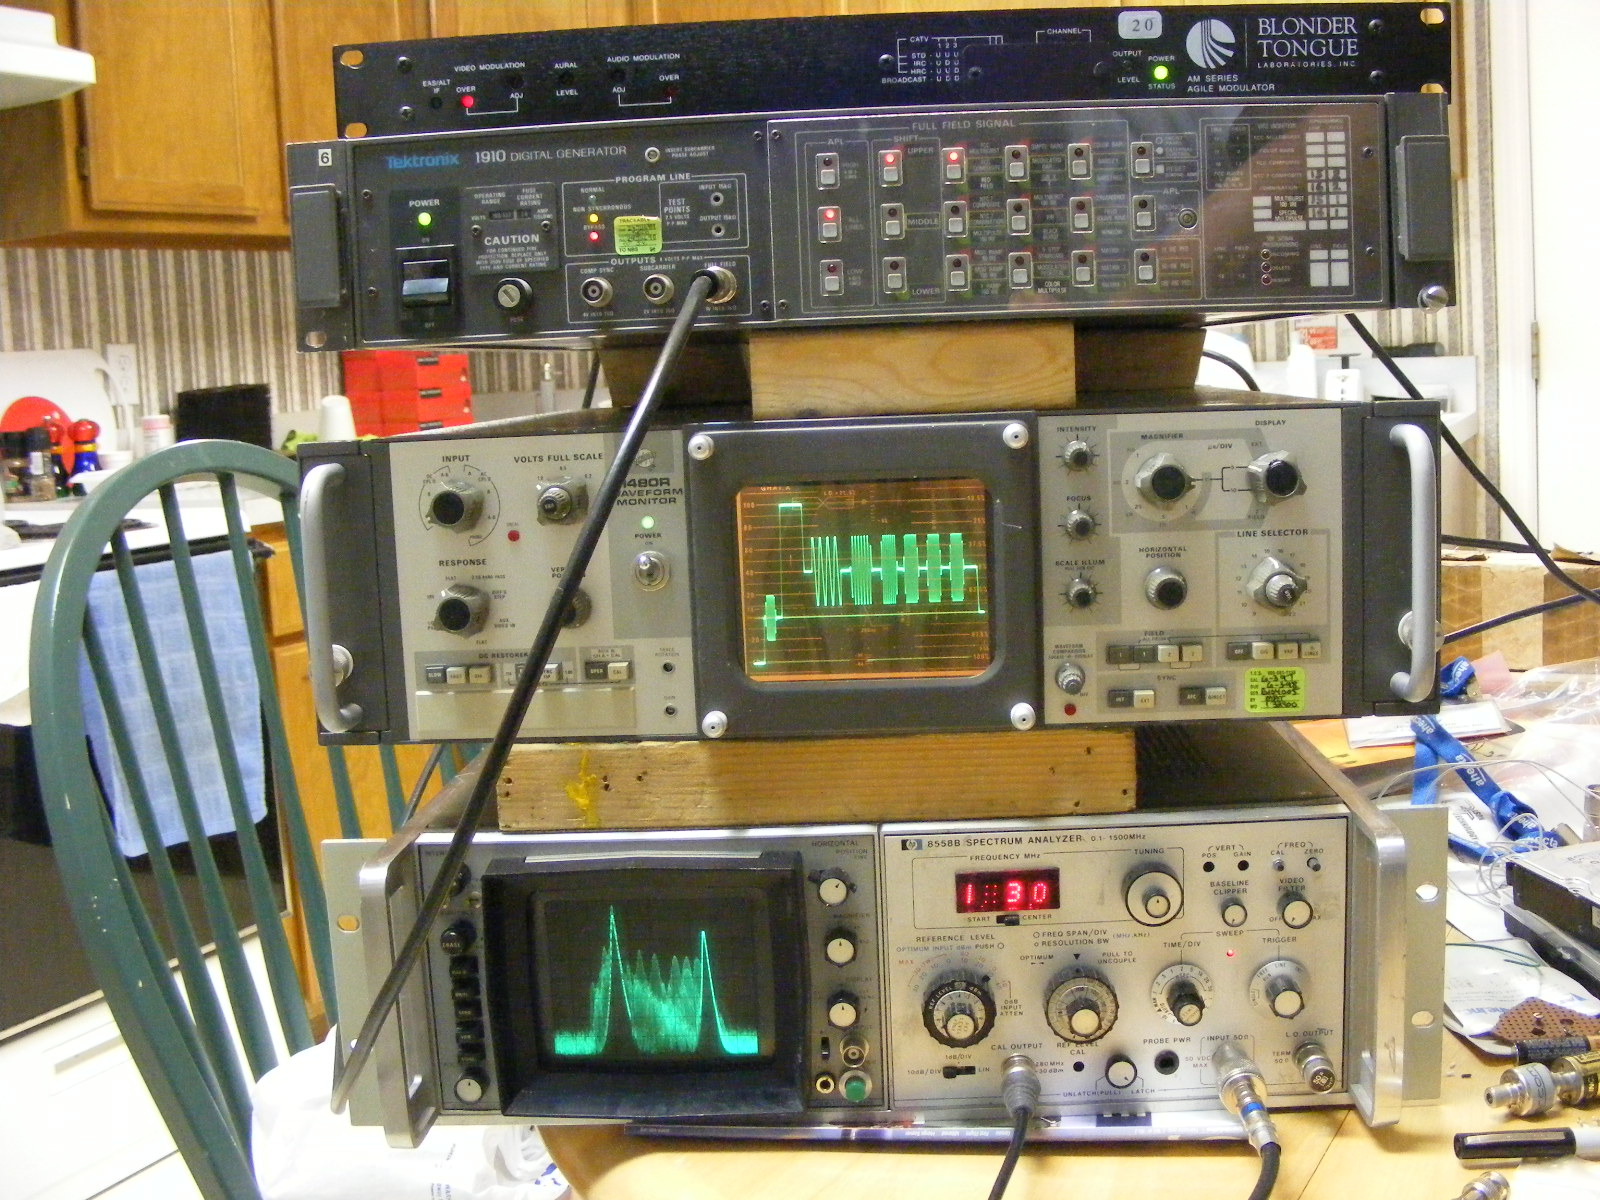
August 23, 2016: I have added one more
photo to this page to show all that obsolete test equipment used above for the
NTSC video tests. This is the raw photo with its full resolution taken on
March 21, 2012 when I set up all this old stuff on my kitchen table. I
picked up these things on ebay at very low prices after the end of NTSC
over-the-air broadcasting. If you are wondering about the RED LED on that
old modulator at the top, I used the linear display on the HP spectrum analyzer
at zero span to set the modulation to 87.5 per cent. And yes, the spectrum
analyzer works great except for the frequency display. I had a Tektronix
1910 and 1480R on my test bench in the 1980's when I worked for Microdyne
Corporation in Silver Springs Shores, Florida.
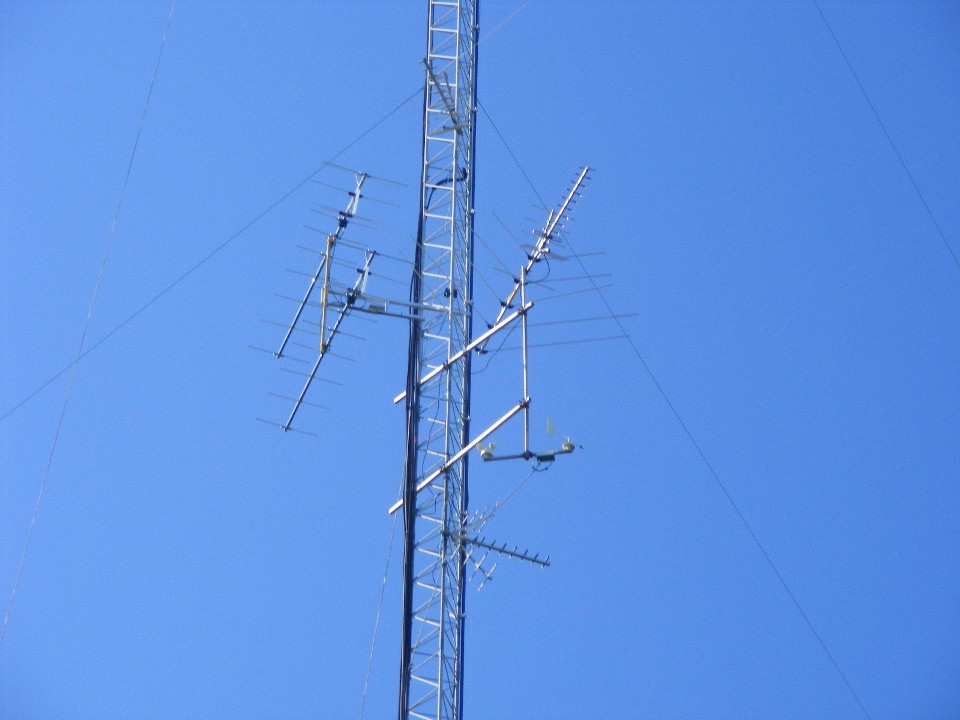
Below is a 2010 photo that goes with the 7L14 spectrum analyzer photo
above. The two high-band VHF antennas on the left are pointed toward
Chattanooga from the Atlanta area. My old college friend is a ham operator
and retired from Hayes Micro modem where he was the design engineer and part
owner in the 1970's. The two antennas seen here are a normal stacked array
for more gain. I taught my friend about stagger stacking to get higher
front-to-back signal ratio. He made the changes and was very happy with
the results. He tried trapping and filtering to select channel 12 only,
but the group delay of the filtering degraded the channel badly. The
180-degree phase cancellation of the signals from Atlanta (rear) and the
in-phase forward path gain from Chattanooga solved his local adjacent channel
problem without filters and traps. After he made the changes, he received
usable signals on channels 9, 12, and 13 from Chattanooga. The other
broadband UHF/VHF antenna on the right is pointed at the Atlanta area TV
stations.
For all the SCTE and other broadcast folks who come to this page, I write my technical articles to "translate from high-tech to plain language" for those who are just starting to "look behind the curtain" on how cable TV works. I always enjoy watching the reaction of non-engineers when they begin to understand how we do the magic. All they want is a clear and sharp picture. My wife still watches standard definition channels because she remembers the channel numbers. She stops listening to me when I use "techie talk". She is happy when I fix her computer problems.
| RETURN to TECHNICAL ARTICLES MENU | CLICK HERE for MAIN MENU |